Best Recruiting KPIs to Track in 2026
Discover essential recruiting KPIs for 2026 to optimize hiring efficiency, cost, and quality, and drive strategic talent acquisition decisions.

Best Recruiting KPIs to Track in 2026
The most critical recruiting KPIs for 2026 include time-to-hire (38-day global median), cost-per-hire ($4,129 average), quality of hire, candidate experience metrics, and diversity pipeline tracking. Teams should also monitor emerging metrics like internal mobility (15-30% target) and AI-driven productivity gains, which can reduce human effort by 40-50%.
TLDR
• Core efficiency metrics: Time-to-hire averages 38 days globally, while cost-per-hire runs approximately $4,129 across industries
• Quality indicators: Quality of hire remains the most valuable metric for 31% of recruiters, calculated using performance, retention, and satisfaction scores
• Candidate experience: Poor communication causes 64% of candidate withdrawals, making experience tracking essential
• Diversity impact: Companies in the top quartile for workforce diversity are 39% more likely to outperform expectations
• AI productivity: Organizations using AI in recruiting hire 26% faster than those without
• Internal mobility: Companies with highest internal mobility rates see 79% more leadership promotions per employee
Recruiting KPIs are the measurable metrics that show talent acquisition teams how well their hiring process performs across quality, speed, cost, and candidate experience. In 2026, tracking the right KPIs matters more than ever. Labour markets remain volatile, AI adoption is accelerating, and recruiters are handling dramatically heavier workloads with leaner teams.
This guide walks through the most important recruiting KPIs to monitor this year, explains why each metric matters, and provides the latest benchmarks to help you set meaningful targets.
What Are Recruiting KPIs (and Why 2026 Looks Different)?
Recruiting KPIs are essential metrics that help talent acquisition teams measure performance and improve outcomes. They transform raw hiring data into actionable insights that drive smarter, faster, and more equitable decisions.
What makes 2026 different? The hiring landscape has fundamentally shifted:
After two years of contraction, hiring grew 8.3% year over year, but volumes remain 30% below 2021 levels. This is the new baseline.
Recruiters now handle 93% more applications and 40% more open roles than in 2021, yet teams are 14% smaller.
82% of companies believe data is critical to drive talent acquisition decisions.
These pressures mean that tracking the right KPIs is no longer optional. Teams that measure what matters can identify bottlenecks, prove ROI, and compete for talent more effectively.
Why Does Tracking Recruiting KPIs Matter in 2026?
Tracking recruiting KPIs directly connects talent acquisition activity to business outcomes. Without measurement, it becomes impossible to identify what is working, justify investments, or improve processes.
Here is why KPI tracking has become essential:
It reveals productivity gaps. 82% of recruiters use analytics to improve their recruiting strategy. Yet 79% still rely on spreadsheets for reporting, creating blind spots that slow decision making.
It proves business impact. Research from McKinsey shows that top performers in critical roles deliver 800% more productivity than average performers in the same role. Tracking quality of hire and related metrics helps organisations understand if they are winning the talent that drives results.
It supports diversity goals. Organisations in the top quartile for workforce diversity are 39% more likely to outperform expectations and 27% more likely to exceed financial targets. Diversity recruiting metrics help teams measure progress and hold themselves accountable.
Key takeaway: KPIs transform recruiting from a cost centre into a strategic function that leaders can trust to deliver measurable business value.
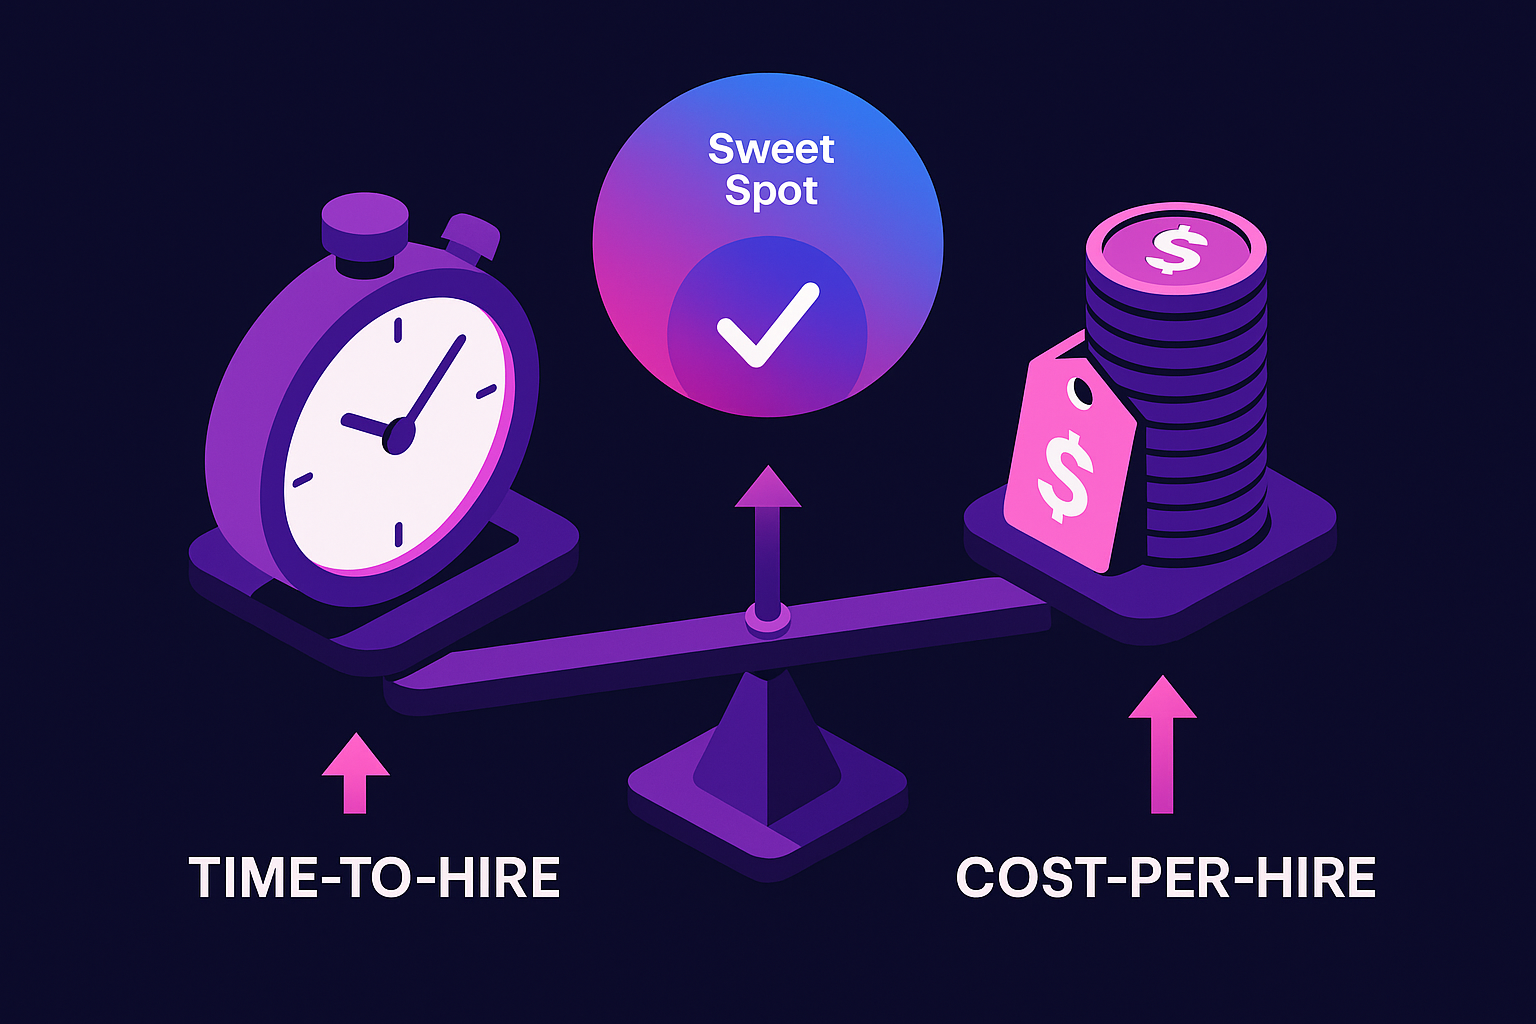
How Do Time-to-Hire and Cost-per-Hire Reveal Efficiency?
Time to hire and cost per hire are the two foundational efficiency metrics every recruiting team should track. Together, they reveal how quickly and cost effectively you fill roles.
Time to hire measures the days from when a candidate enters the pipeline (or a requisition opens) to when they accept an offer.
Longer timelines often signal process bottlenecks, poor candidate communication, or misalignment between recruiters and hiring managers.
Cost per hire captures the total internal and external recruiting costs divided by the number of hires. It includes everything from job advertising and recruiter salaries to agency fees and technology costs.
Why do these metrics matter together? A low cost per hire means little if it takes 90 days to fill a role. Similarly, fast hiring becomes expensive if you are overspending on agencies or advertising. The goal is to optimise both.
According to SHRM, the average time to fill is 42 days, and the average cost per hire is around $4,129 across industries.
2026 Time-to-Hire Benchmarks
Global benchmark data provides useful targets for 2026:
| Benchmark | Days |
|---|---|
| Global median time to hire | 38 days |
| Average time to fill (all company sizes) | 47.5 days |
| Retail industry (34% faster than median) | ~25 days |
| AI-enabled teams | 26% faster than non-AI teams |
Organisations aiming for top quartile performance should target 28 to 30 days and measure stage level drop offs to uncover where candidates stall.
Refining Cost-per-Hire Calculations
The standard formula for cost per hire is:
Cost per hire = (internal recruiting costs + external recruiting costs) / number of hires
This formula comes from industry standard methodology and provides a consistent way to benchmark against peers.
To lower cost per hire without sacrificing quality, focus on these levers:
Improve sourcing channel efficiency. Track which sources deliver qualified candidates at the lowest cost. The formula for sourcing channel efficiency is: Number of qualified candidates from a specific source minus the average number of applicants from all sources.
Reduce agency dependency. Internal sourcing and referrals typically cost less than external agencies.
Automate repetitive tasks. Screening, scheduling, and candidate communication can all be automated to reduce recruiter time per hire.
Leverage existing talent pools. Nearly 46% of sourced hires now come from rediscovered candidates already in your CRM or ATS, up from 26% in 2021.
What Defines Quality-of-Hire in 2026?
Quality of hire measures how well new employees perform after they join. It is consistently ranked as the most valuable metric by 31% of recruiters, ahead of time to fill and cost per hire.
The challenge is that quality of hire is harder to quantify than speed or cost metrics. Most organisations use a blended score that combines multiple inputs.
The standard formula is:
Quality of hire score = (performance score + retention score + hiring manager satisfaction score) / 3
This formula from Tracker RMS provides a simple starting point. Some teams add additional factors like time to productivity, peer feedback, or promotion velocity.
A related metric is early turnover rate, which measures new hires who leave within a defined period (often 90 days or 6 months):
Early turnover rate (%) = (new hires who left within X months / total hires in same cohort) x 100
High early turnover signals problems with job fit, onboarding, or misaligned expectations during the hiring process.
Some organisations are seeing significant improvements by focusing on quality. Adway reports that clients using their platform have achieved a 36% increase in quality of hire alongside faster time to hire. As Måns Liljenlov, Employer Brand & Relations Manager at PwC Sweden, noted: "Today, we have better conversations with fewer but more relevant candidates. That's what quality looks like to us!"
How Do Candidate Experience and Diversity KPIs Impact Hiring?
Candidate experience and diversity metrics represent the human side of recruiting. Both directly influence your ability to attract and hire top talent.
Candidate Experience Metrics
Candidate experience shapes how people talk about your company, how quickly you fill roles, and whether top talent chooses you over competitors. Currently, 56% of companies use candidate experience as one of the main data points in their recruitment analysis.
The most common measure is Candidate Net Promoter Score (cNPS), calculated as:
cNPS = % promoters – % detractors
A more comprehensive approach is the Candidate TRUST Framework, which measures five pillars:
- Transparency – Are candidates informed about the process and timeline?
- Reciprocity – Do candidates receive value (feedback, respect) in return for their time?
- Unity – Do candidates feel aligned with company values?
- Speed – Is the process efficient and respectful of candidate time?
- Truthfulness – Does the role match what was advertised?
Poor candidate experience has measurable consequences. Research shows that 64% of candidates who withdraw cite poor communication as their reason for dropping out.
Diversity Recruiting Metrics
Diversity metrics help organisations track progress toward building representative teams. Common measures include:
- Pipeline diversity by stage (application, interview, offer, hire)
- Representation rates by demographic group
- Hiring velocity differences across groups
Research demonstrates that diversity metrics work. In a field experiment with over 5,500 participants, including measurable diversity goals in job postings increased applications from women and racial minorities by 6.5%, without sacrificing candidate quality.
Key takeaway: Organisations that measure candidate experience and diversity create feedback loops that drive continuous improvement in both areas.

Which Emerging Recruiting KPIs Will Gain Traction?
Beyond traditional metrics, several emerging KPIs are gaining importance in 2026.
Internal Mobility Rate
Internal mobility measures the percentage of positions filled by internal candidates. The formula is:
Internal mobility rate = (Number of internal moves / Total number of job openings) x 100
Ideal targets typically range from 15% to 30%, depending on industry and organisational structure. High internal mobility correlates with improved employee satisfaction, retention, and operational efficiency.
The business case is compelling. According to LinkedIn data, companies with highest internal mobility rates saw 79% more leadership promotions on a per employee basis. Employees who make internal moves are 40% more likely to stay at the company for at least three years.
Despite these benefits, only 33% of organisations offer formal internal mobility programmes, creating an opportunity for those who invest in this area.
AI-Driven Productivity Metrics
As AI tools become standard in recruiting, teams need new metrics to measure their impact. Key measures include:
- Hours saved per hire – Baseline manual hours per hire minus current manual hours per hire
- Automation rate – Percentage of tasks handled by AI versus humans
- AI-sourced candidate quality – Performance of candidates identified by AI tools
The potential gains are significant. PwC research indicates that across HR, AI agents can reduce human effort by 40 to 50%. In talent sourcing specifically, savings for hiring managers can reach 70%.
Companies using AI in their recruiting processes hire 26% faster, according to SmartRecruiters benchmark data. Tracking AI productivity metrics helps teams quantify this advantage and identify further automation opportunities.
What Dashboards and Benchmarking Tools Make KPI Data Actionable?
Tracking KPIs is only valuable if the data drives action. Modern recruiting analytics tools help teams move from raw numbers to strategic insights.
Essential Dashboard Capabilities
Effective recruiting dashboards should provide:
Source attribution. ATS-enabled reporting allows you to measure and compare performance by sources, showing which channels produce the most quality hires.
Funnel visualisation. Track conversion rates at each stage from application to hire. This reveals exactly where candidates drop off.
Benchmark comparison. The ROI Dashboard from Jobvite, for example, benchmarks your performance against companies in your industry, size, and region.
Real time updates. Waiting for monthly reports means missing opportunities to course correct. Modern dashboards provide continuous visibility.
Source of Hire Tracking
Source of hire shows what percentage of your overall hires entered your pipeline from each recruiting source. The formula is:
Source of hire (%) = (hires from a source / total hires) x 100
Understanding source effectiveness helps optimise recruiting spend. Data shows that sourced candidates are 8x more likely to be hired than inbound applicants, making direct sourcing worth the investment for many roles.
LinkedIn integrations can help with source tracking. Tools like Job Wrapping help achieve up to 100% job slot utilisation, maximising exposure to relevant candidates while maintaining clear attribution.
For teams looking to optimise their recruiting analytics, platforms like Adway provide real time data on views, clicks, and candidate flows, along with performance metrics like CPM, CPC, and CPA to help track ROI across social recruiting campaigns.
Common Pitfalls When Measuring Recruiting KPIs
Even well intentioned KPI programmes can go wrong. Here are the most common mistakes to avoid.
Chasing Vanity Metrics
Vanity metrics are numbers that look impressive in reports but do not necessarily correlate with business outcomes. High application volumes, social media impressions, and follower counts can feel good without actually improving hiring results.
The fix: Always connect metrics to hiring outcomes. Track whether social engagement leads to applications, whether applications convert to hires, and whether those hires perform well.
Ignoring Algorithmic Bias
AI screening tools can inadvertently perpetuate biases from historical hiring data. Best practices for bias mitigation include:
- Statistical parity within ±5% across demographic groups for selection rates
- Removing or masking protected characteristics during initial screening
- Maintaining audit logs for retrospective bias analysis
- Human in the loop review before final decisions
The system should alert when disparate impact exceeds the 80% threshold, known as the four fifths rule.
Selecting Too Many KPIs
KPIs are, by definition, the key or most vital measures for your department. Tracking dozens of metrics dilutes focus and makes it harder to identify what truly matters.
The fix: Start with five to seven core KPIs that align with your team's priorities. You can always add more later, but begin with the essentials: time to hire, cost per hire, quality of hire, source effectiveness, and candidate experience.
Bringing It All Together
Recruiting teams that outperform in 2026 focus on a balanced KPI set that covers:
- Speed: Time to hire benchmarked at approximately 38 days globally
- Cost: Median cost per hire around $4,100
- Quality: Blended quality of hire score combining performance, retention, and manager satisfaction
- Experience: Candidate NPS and stage drop off rates
- Diversity: Pipeline mix and measurable diversity goals
- Emerging levers: Internal mobility rate (target 15 to 30%) and AI driven hours saved per hire
Tracking these metrics together links recruiting activity directly to revenue, productivity, and brand health.
The tools exist to make this practical. AI powered dashboards, ATS integrations, and benchmark reports provide the data. What matters now is committing to measurement, acting on insights, and continuously refining your approach.
For organisations looking to improve their recruiting KPIs, platforms like Adway offer AI driven social recruiting technology that helps attract passive talent at scale. Recognised as a Core Leader in the 2026 Fosway 9-Grid for Talent Acquisition, Adway combines programmatic job advertising with analytics that track the metrics that matter most.
Frequently Asked Questions
What are recruiting KPIs and why are they important in 2026?
Recruiting KPIs are metrics that measure the effectiveness of hiring processes, crucial in 2026 due to volatile labor markets and increased AI adoption. They help identify bottlenecks, prove ROI, and enhance talent acquisition strategies.
How do time-to-hire and cost-per-hire metrics improve recruiting efficiency?
Time-to-hire measures the speed of filling roles, while cost-per-hire calculates the expenses involved. Together, they help optimize recruitment processes by balancing speed and cost, ensuring efficient and cost-effective hiring.
What is the significance of quality-of-hire in recruitment?
Quality-of-hire assesses new employees' performance post-hiring. It's a key metric for understanding the impact of recruitment on business outcomes, combining performance, retention, and satisfaction scores to gauge hiring success.
How do candidate experience and diversity KPIs affect hiring?
Candidate experience and diversity KPIs influence talent attraction and retention. Positive experiences and diverse hiring practices enhance employer reputation and ensure a broader talent pool, improving overall recruitment outcomes.
What emerging recruiting KPIs should be tracked in 2026?
Emerging KPIs include internal mobility rate and AI-driven productivity metrics. These measure internal promotions and the efficiency gains from AI tools, helping organizations optimize talent management and recruitment processes.
How does Adway's platform enhance recruiting KPIs?
Adway's AI-driven social recruiting platform improves recruiting KPIs by automating job advertising and providing analytics to track key metrics, helping organizations attract passive talent and optimize hiring strategies.
Sources
- https://www.linkedin.com/business/talent/blog/talent-acquisition/how-internal-mobility-benefits-employers
- https://www.pwc.com/us/en/tech-effect/ai-analytics/agentic-ai-in-hr.html
- https://www.starred.com/blog/candidate-experience-benchmarks
- https://www.shrm.org/topics-tools/tools/toolkits/beam-framework-toolkit
- https://ta.smartrecruiters.com/rs/664-NIC-529/images/Recruitment-Benchmarks-2025-Report.pdf?version=0
- https://fetcher.ai/blog/recruiting-kpis-and-recruitment-analytics-guide
- https://www.gem.com/resource/recruiting-benchmarks
- https://www.tracker-rms.com/blog/10-recruitment-kpis/
- https://www.jobvite.com/blog/from-spreadsheets-to-strategy-how-jobvites-ai-powered-dashboards-turn-recruiting-data-into-business-impact/
- https://www.mckinsey.com/capabilities/people-and-organizational-performance/our-insights/increasing-your-return-on-talent-the-moves-and-metrics-that-matter
- https://www.crystalknows.com/resource/how-to-measure-recruiting-metrics
- https://nxtthingrpo.com/2023/10/recruiting-funnel-metrics/
- https://www.netsuite.com/portal/resource/articles/human-resources/recruitment-kpi.shtml
- https://adway.ai/attract-1
- https://www.guide.co/blog/candidate-trust-framework?amp;utm_source=RBF&utm_medium=newsletter&utm_content=trust-framework
- https://psycnet.apa.org/journals/0096-3445/154/3/624.pdf
- https://kpidepot.com/kpi/internal-mobility-rate
- https://www.linkedin.com/help/recruiter/answer/a500012
- https://business.linkedin.com/talent-solutions/linkedin-hiring-integrations/ats-integrations
- https://adway.ai/data-performance-roi
- https://www.peoplescout.com/insights/social-media-metrics-for-recruitment/
- https://quality.arc42.org/requirements/hiring-algorithm-bias-mitigation
- https://www.fosway.com